
Jobs -> Strong but underlying signs of slowing
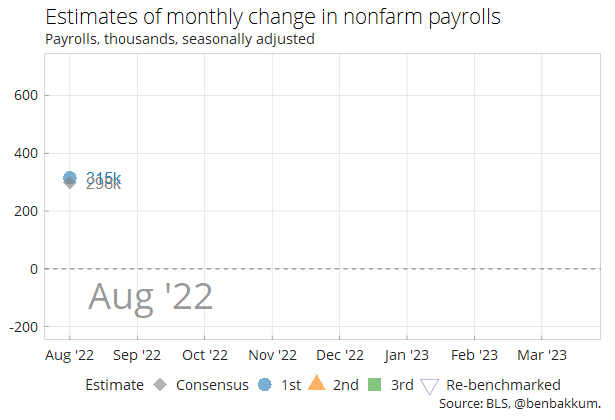
Job gains in March slightly beat expectations, with gains of 236k jobs. Gains in November and December were revised down by a combined 17k.
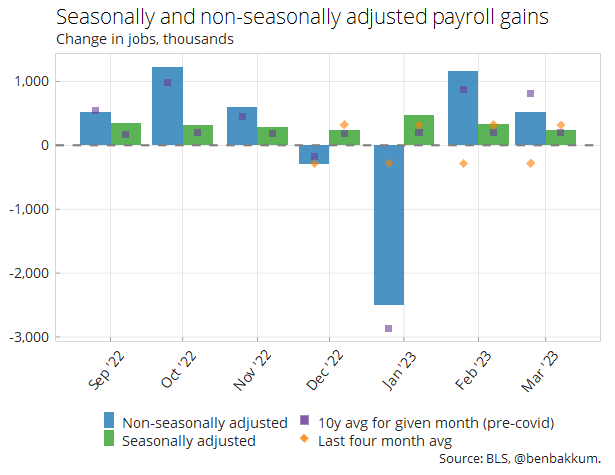
On a non-seasonally adjusted basis, the net number of payrolls added in March is below the pre-covid average of the last ten Marches. On a seasonally adjusted basis, March job gains were about in line with the average based on longer-term history.
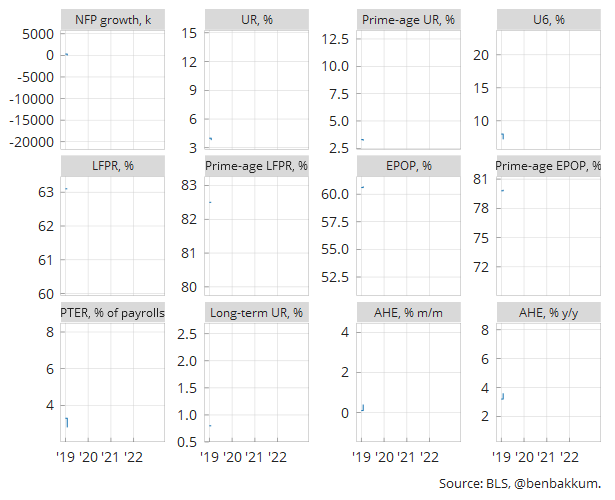
The unemployment rate ticked down back to 3.5%. Labor force participation strengthened in march.
| Sep-22 | Oct-22 | Nov-22 | Dec-22 | Jan-23 | Feb-23 | Mar-23 | |
|---|---|---|---|---|---|---|---|
| NFP growth, k | 350 | 324 | 290 | 239 | 472 | 326 | 236 |
| UR, % | 3.5 | 3.7 | 3.6 | 3.5 | 3.4 | 3.6 | 3.5 |
| Prime-age UR, % | 2.9 | 3.2 | 3.2 | 2.9 | 3 | 3.1 | 2.9 |
| U6, % | 6.7 | 6.7 | 6.7 | 6.5 | 6.6 | 6.8 | 6.7 |
| LFPR, % | 62.3 | 62.2 | 62.2 | 62.3 | 62.4 | 62.5 | 62.6 |
| Prime-age LFPR, % | 82.6 | 82.5 | 82.3 | 82.4 | 82.7 | 83.1 | 83.1 |
| EPOP, % | 60.1 | 60 | 59.9 | 60.1 | 60.2 | 60.2 | 60.4 |
| Prime-age EPOP, % | 80.2 | 79.8 | 79.7 | 80.1 | 80.2 | 80.5 | 80.7 |
| PTER, % of payrolls | 2.4 | 2.3 | 2.3 | 2.4 | 2.5 | 2.5 | 2.5 |
| Long-term UR, % | 0.7 | 0.7 | 0.7 | 0.6 | 0.7 | 0.6 | 0.7 |
| AHE, % m/m | 0.3 | 0.4 | 0.4 | 0.4 | 0.3 | 0.2 | 0.3 |
| AHE, % y/y | 5.1 | 4.9 | 5 | 4.8 | 4.4 | 4.6 | 4.2 |
| Source: BLS, @benbakkum. |
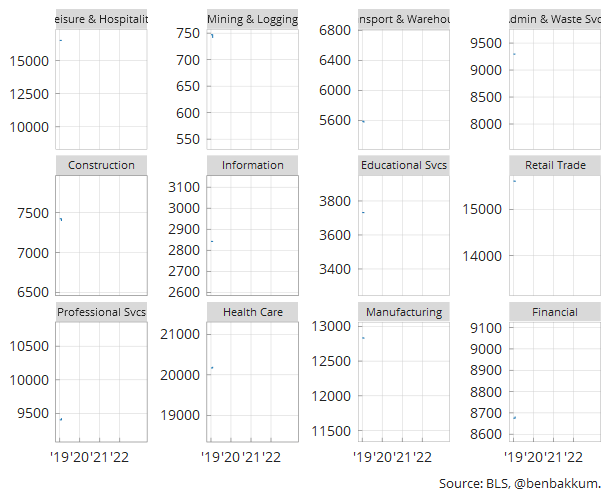
Private education and health care services stand out as industries where employment is growing at a strong pace.Outside of these industries, interest rate sensitive sectors such as manufacturing and construction have leveled off in terms of job gains. Information, which includes tech jobs, has rolled over.
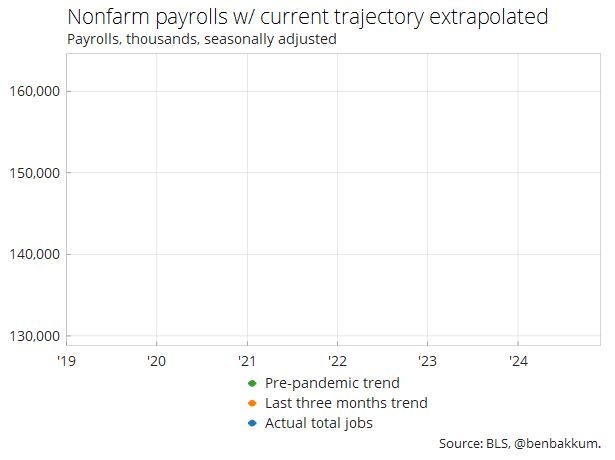
If the average job growth of the last three months continues at the same pace, the total number of jobs would by the end of 2024 fully recover to where it would have likely ended up had the pandemic not occurred. In many ways that would be an even tighter labor market than before the pandemic as the population has aged and a large number of workers have retired in the intervening period.
An aggregate measure of labor market conditions, the Blanchflower-Levin employment gap, shows that there is essentially no more slack left in the labor market. It’s important to note however, that the participation gap shown here is based on the overall participation rate.
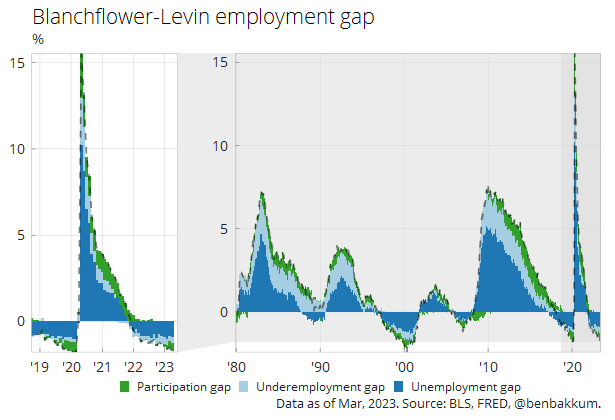
Note: the unemployment gap is the difference between the unemployment rate and an estimate of the non-accelerating inflation rate of unemployment (NAIRU). The participation gap is the difference between the labor force participation rate (LFPR) and the CBO’s estimate of the potential LFPR. The underemployment gap is the difference between the number of employees working part-time for economic reasons as a percentage of the labor force, adjusted for the difference in the average number of hours worked by part-time and full-time employees, and the 1994-2007 average of this calculation.


