| I have recently donated to the Real Justice PAC, which works to elect reform-minded prosecutors at the county and municipal level, and encourage you to consider also donating. |
Last week's US nonfarm payrolls report caused a lot of head scratching, as it showed total employment increased by 2.5 million jobs in May despite a range of other data points leading up to the report that suggested the economy continued to hemorrhage jobs last month. The unemployment rate changed course and declined 1.4%pts to 13.3%, while some analysts' forecasts placed it as reaching around 20% in May.
The numbers were unexpected enough that a debate sprung up on Twitter over the possibility of the administration's Bureau of Labor Statistics cooking the books in order to shore up confidence ahead of the November election. While cries of conspiracy are backed by no evidence, any conclusions drawn from the report should acknowledge the difficulties tracking volatile swings in economic measures at a time like this, and that one thing we can say with certainty is that the labor market remains in a dire condition.
First, it's worth caveating that even during non-crisis periods the jobs report can seem akin to a random number generator. It's notoriously hard to predict the country's monthly change in employment, and even the BLS' initial estimates are subject to significant revision. A single monthly data point should not warrant declarations of a new direction for the economy, as the next month's number can just as likely bounce the other way, or the current month's number may eventually be completely different after revisions. That being said, the virus makes averaging several months of labor data to gauge an overall trend fruitless because the economies of pre-March and post-March may just as well have existed in alternate universes.
Second, commentators aren't wrong to claim the BLS has published headline numbers it knows aren't accurate. Even so, speculation of political influence warping the data has no basis. The BLS has been consistent and transparent in disclosing a misclassification of respondents to their survey that has caused underestimates of the unemployment rate. BLS' interviewers were instructed to record employed persons absent from work due to the virus as 'unemployed on temporary layoff.' Instead, some interviewers have mistakenly marked these persons as 'employed but absent from work due to other reasons.' The BLS has caught this error over the last several months, but it has refrained from reclassifying respondents due to a policy of accepting survey results as recorded, a policy in effect for the exact purpose of preventing any tampering with the politically significant and market-moving jobs data.
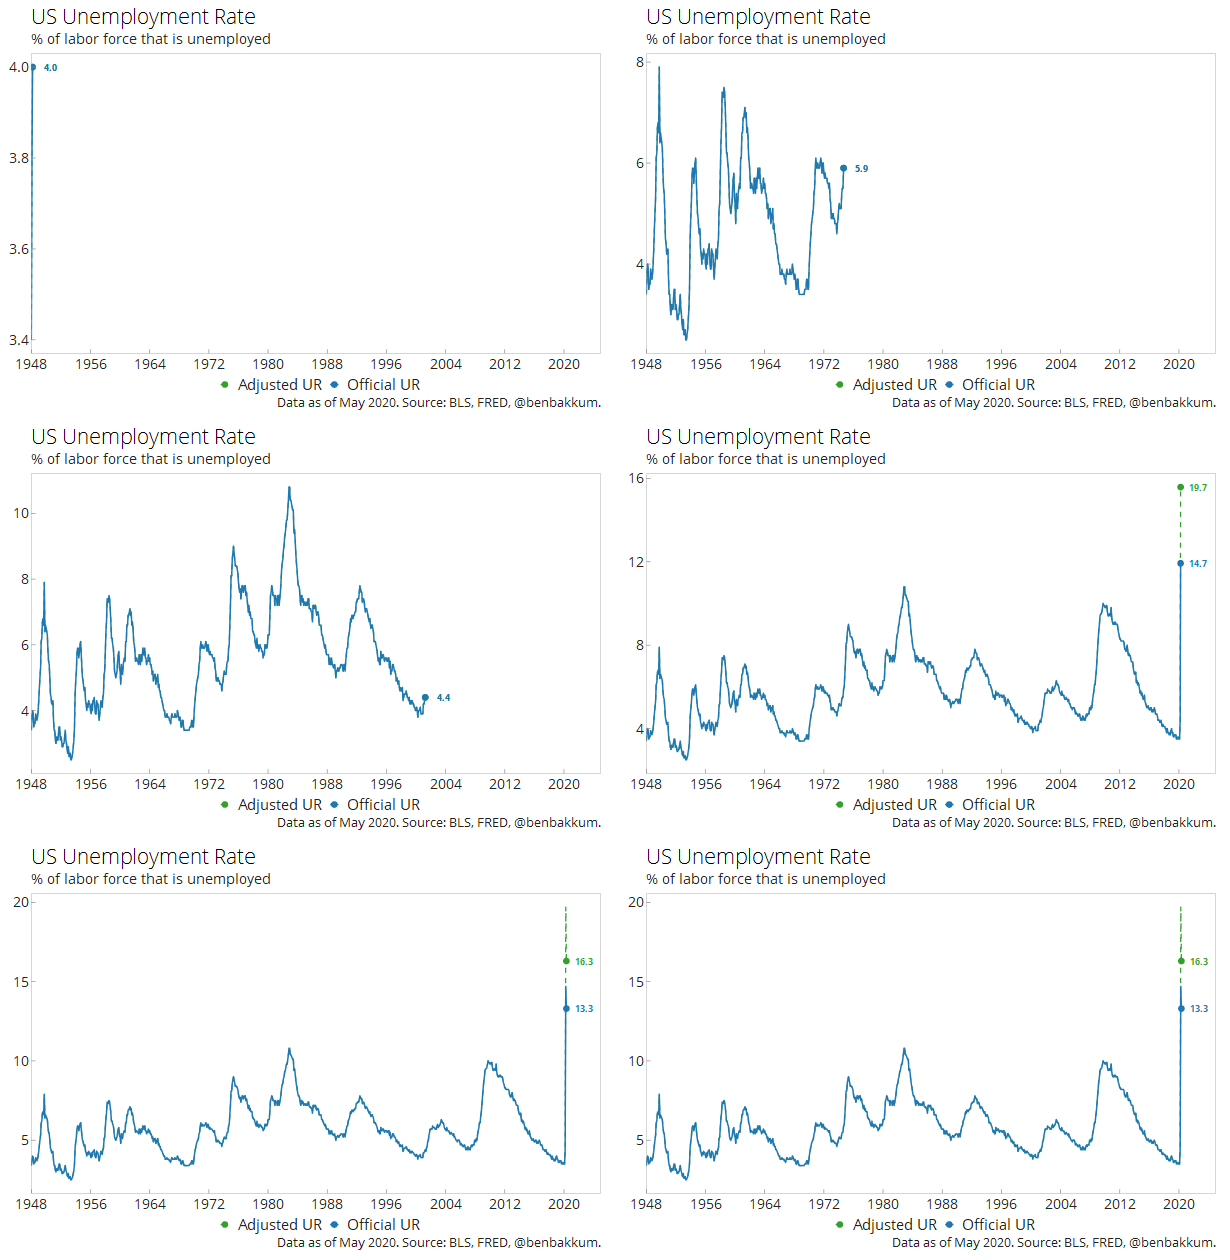
The BLS knows the extent of the issue and has provided estimates of where the unemployment rate would have landed had the problem respondents been reclassified to their proper cohort. The chart below shows the longer-term history of the unemployment rate through this latest report, along with an adjusted rate in recent months showing where the BLS says the unemployment rate would have been reported were it not for the misclassifications.

Two things stand out from the visual above -> (1) However you slice it, whether you're looking at the official or adjusted rates, the surge in unemployment we've seen in the first half of this year is historic and on a scale the US has not grappled with since the Great Depression (2) In May, both official and adjusted rates declined. Even if the higher and more accurate unemployment rate provided by the BLS in a footnote of the report for May had been what had made it into the headlines, the articles would have still had the same narrative because the adjusted rate for April was higher still.
Also, focusing on either unemployment rate or the 2.5 million net jobs added in May glosses over much of the underlying dynamics of the labor market we can glean from the report. That 2.5 million represents a figure differentiating two other numbers, the gross amount of jobs added and the amount of jobs lost. Though a rebound of the temporarily unemployed back into jobs at reopening businesses such as restaurants and dentists offices outweighed job losses in May, 2.3 million Americans were 'permanent job losers' during the month as described by the BLS, a sign of a labor market in turmoil.
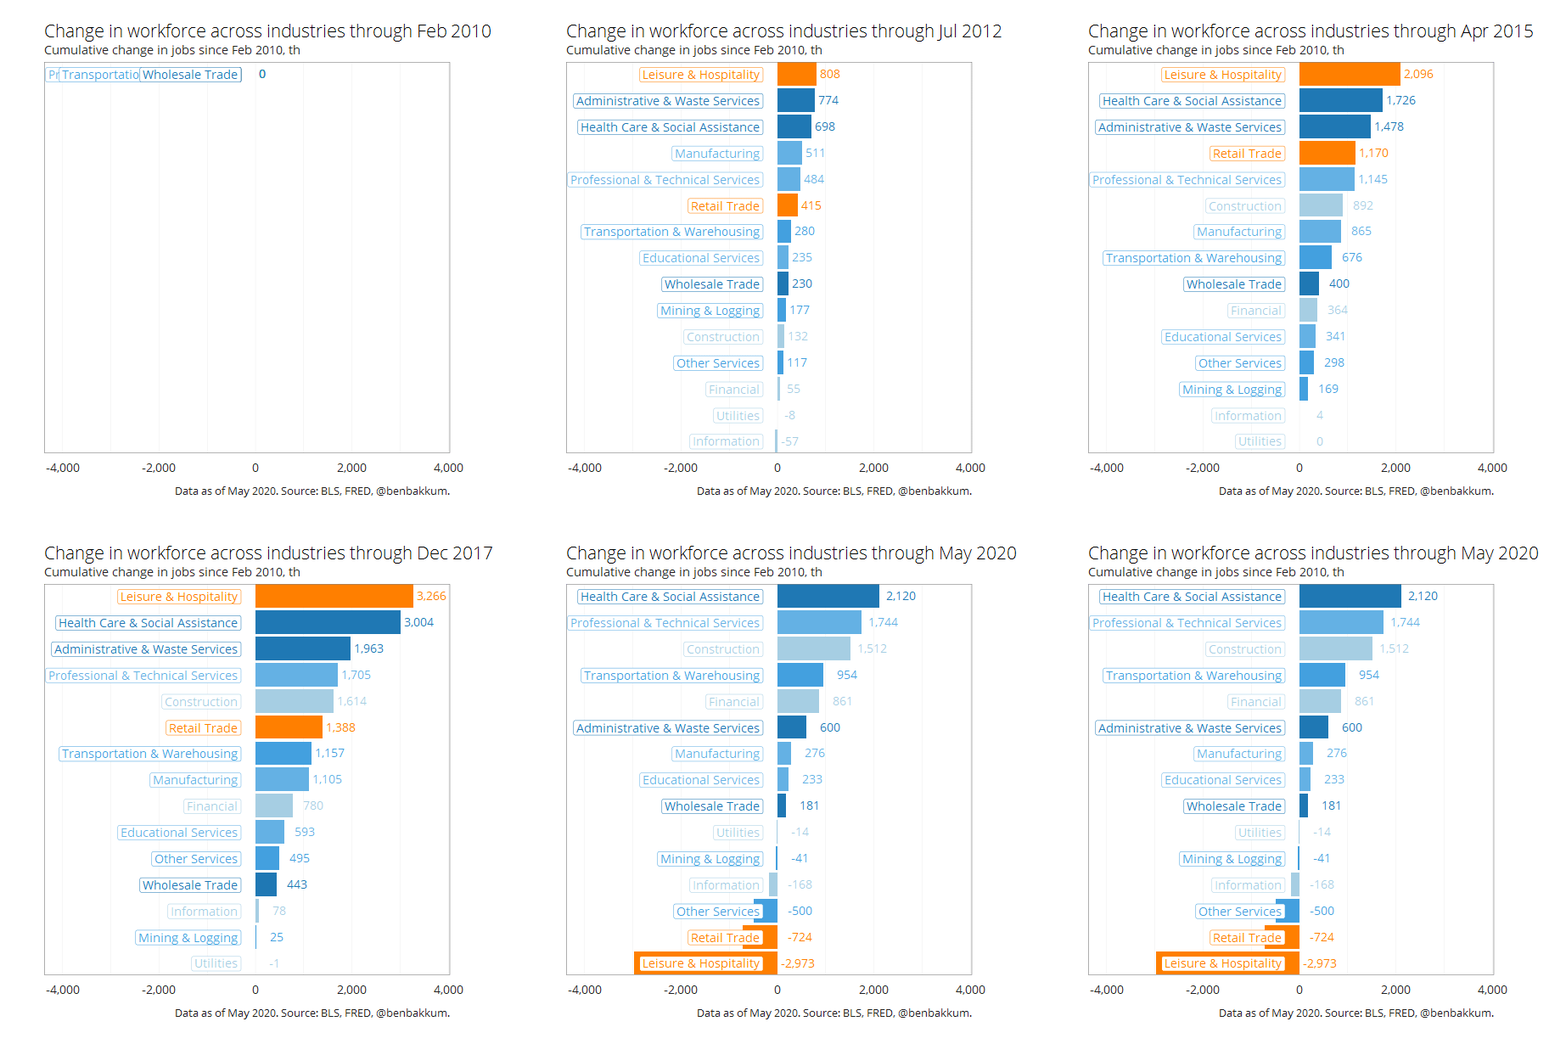
Looking under the hood of the jobs report, the rebound in food service employment in May on the back of reopening and PPP stimulus partially reversed steep losses in March and April, but employment in the overall leisure and hospitality industry that includes restaurants remains well below levels even in the depths of the Great Financial Crisis, erasing a decade of job growth in the industry and then some. As illustrated by the chart below, between early 2010 and early 2020, leisure and hospitality added nearly 4 million jobs to the US economy. In a matter of months, around 7 million industry jobs have been lost. Retailers have also borne the brunt of the shutdowns.

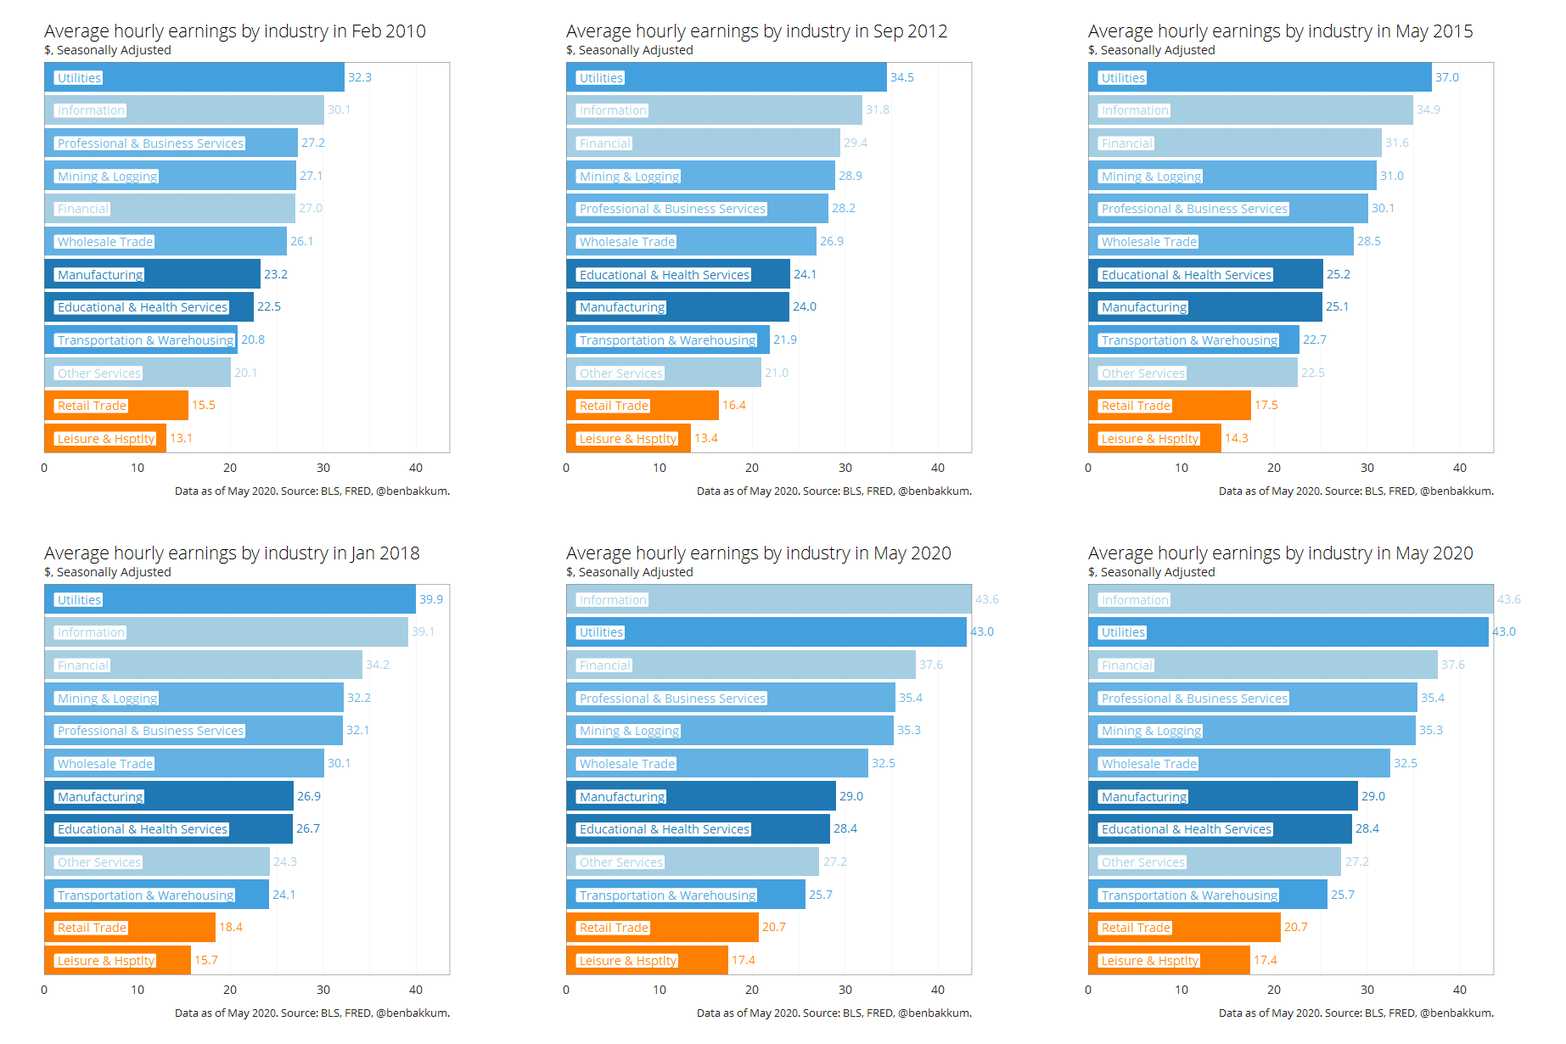
In an example of the uneven effects of the virus across socioeconomic groups, retail as well as leisure and hospitality are industries with average hourly earnings at the bottom of the spectrum. While these industries saw wage growth during the 2010s, that growth was not at a speed that lifted them relative to other industries.

We can take some solace in a much better than expected jobs report, but the reality that labor market conditions remain calamitous and may worsen before they further improve should not be ignored.


