COVID-19 -> Inflection points
The fall brought with it a surge in virus cases, especially in the Midwest, yet daily positive test numbers averaged over a week appear to have recently rolled over in the most hard hit states. This is good news, given that typically once states have stopped the rise in daily new infections, the growth in cases has continued to slow over the short-term. The context of this surge relative to those of the spring and summer, however, is important. It’s likely that what spread resulted from recent holiday travel has not yet shown up in the numbers, creating the potential that the recent peaks in many states may be surpassed as daily new cases inflect higher again.
The next week or two will be telling of the detrimental effects of Thanksgiving, but regardless of whether the holiday makes the following days’ case counts incrementally worse or not, this winter will be a long and hard one before the promise of warmer weather and vaccines arrives in the spring. These charts show a pattern in the trajectories of case numbers, namely that the descent from peaks takes much longer than the upward rise. Even were the all time highs of new cases per day in most states behind us, many more Americans will be infected as the rate of spread falls from these levels.
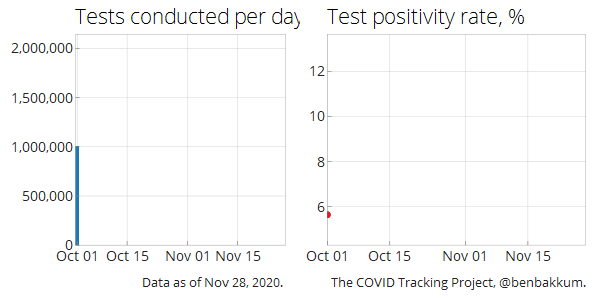
In updates to other charts, it’s clear that as testing has continued to expand, the rate of positivity has also steadily climbed.
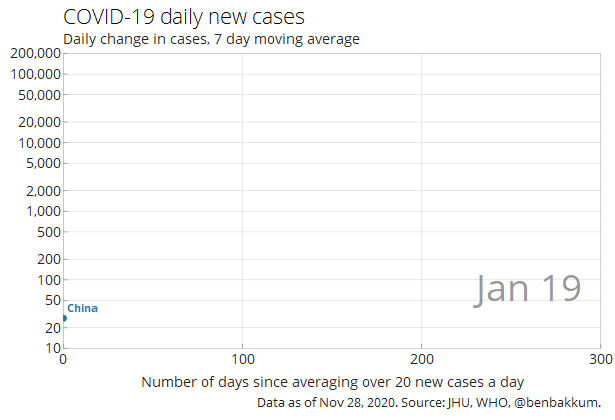
Looking globally, the US has far surpassed all other countries in the scale of its continued spread.