Nonfarm payrolls declined by 140,000 jobs in December, coming after the rebound in job growth steadily slowed during the second half of the year. December marks the first fall in employment since April’s collapse, as the high levels of COVID cases have buffeted employers. The headline unemployment rate stayed at 6.7%.

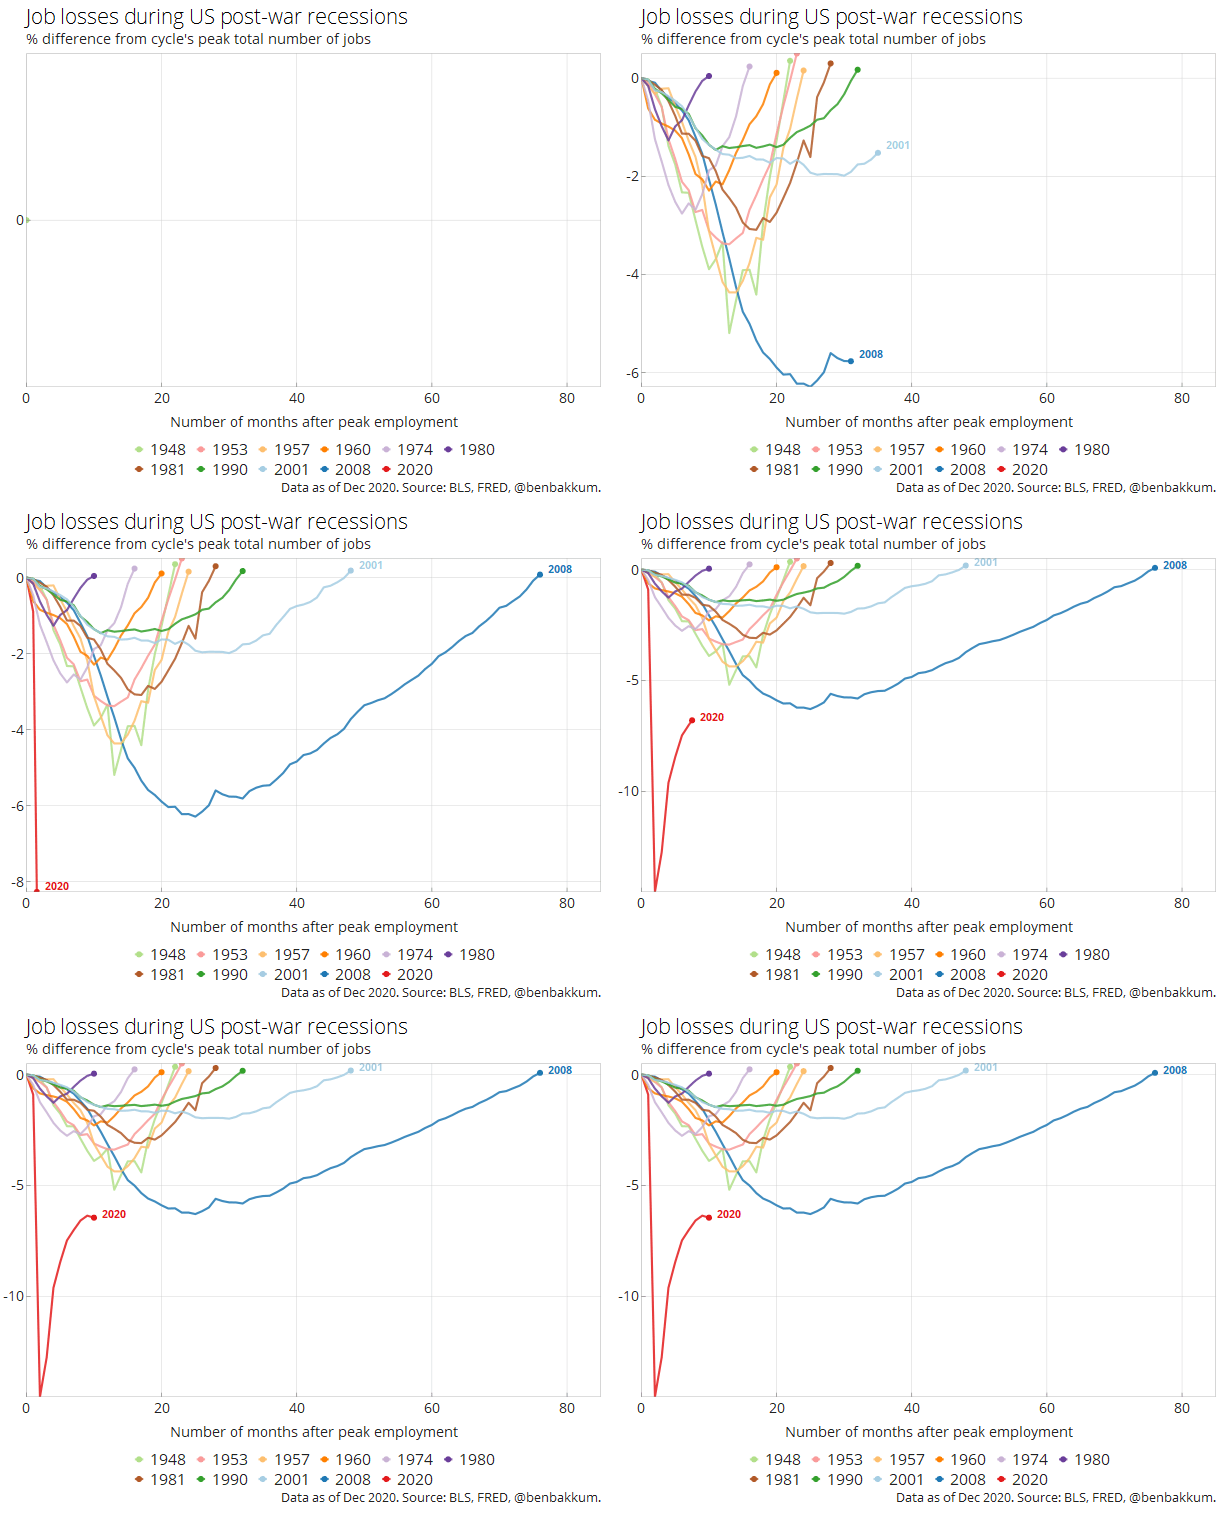
As shown in the chart above, with the recovery rolling over around the percentage of job losses reached in the depths of the recession caused by the Global Financial Crisis, the economy is a long, long way away from the health of the labor market pre-pandemic. Ernie Tedeschi notes that averaging the job growth of the last three months and assuming that pace continues, it would still take around three years to reach the employment level of February 2020, not to speak of where the labor market would be at that point had it maintained its pre-pandemic rate of job gains.
With today's -140,000 payroll read, the average monthly jobs growth over the last three months has been +283,000. That would normally be excellent performance. But not now. It means it'd take three years just to get back to Feb 2020 employment. Hopefully growth will accelerate. pic.twitter.com/1rKMEyv8lW
— Ernie Tedeschi (@ernietedeschi) January 8, 2021
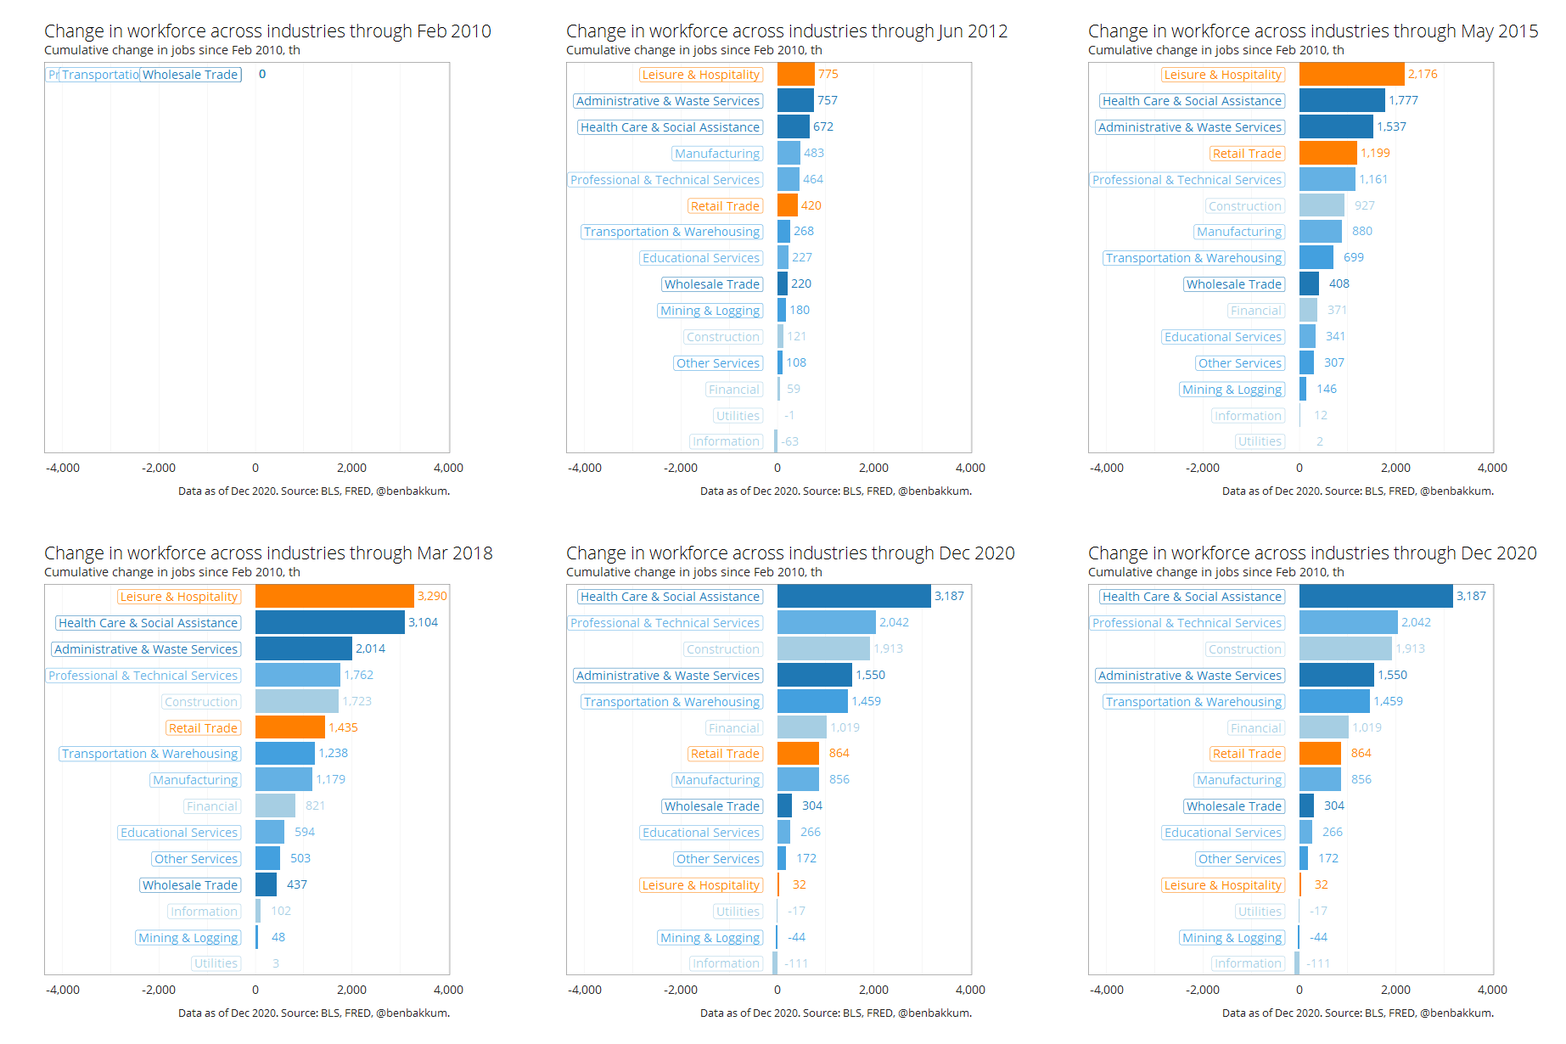
The types of industries hit hardest by the pandemic last spring are again suffering, with around half a million leisure and hospitality jobs lost in December. I think the chart below really illustrates the long, slow climb that characterized job growth across industries during the previous expansion, and how COVID has taken only a few months to swing employment up and down in certain sectors to create changes that would typically occur over decades. the leisure and hospitality industry now employs around the same amount of workers that it did in February 2010.

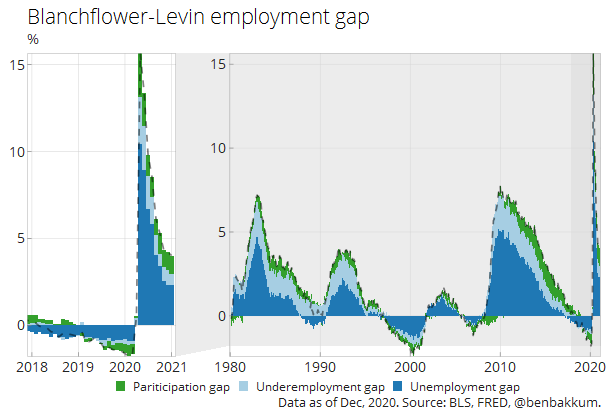
Also, weak labor force participation and underemployment remain issues in their own right. I wrote last August about an aggregate indicator of an unemployment gap, a participation gap, and an underemployment gap developed by economists Danny Blanchflower and Andrew Levin and provide an updated chart of my approximation of their approach below.

Note: the unemployment gap is the difference between the unemployment rate and the non-accelerating inflation rate of unemployment (NAIRU). The participation gap is the difference between the labor force participation rate (LFPR) and the CBO’s estimate of the potential LFPR. The underemployment gap is the difference between the number of employees working part-time for economic reasons as a percentage of the labor force, adjusted for the difference in the average number of hours worked by part-time and full-time employees, and the 1994-2007 average of this calculation.
In addition to the recovery in employment stalling out, the spike in labor force dropouts and the number of underemployed has not yet been reversed and may stand to worsen as the winter drags on and the vaccine rollout sputters. The risk is that it may be years before the labor market heats up enough to begin to draw people (those young enough to still have the means to work) back into the labor force and for those stuck with part-time gigs to make their eay back to full-time occupations.


