
Jobs -> Payrolls miss but household survey strong again
Job gains in December came in below expectations. A more holistic view of the data, however, shows that the recovery in the labor market remains on track, similar to the dynamic of the November report. Establishment survey metrics continue to look weaker relative to the metrics based on the Household survey. Interestingly, some of this disparity may be coming from non-sampling error due to the establishment survey’s inability to capture employment generated by new firms. The BLS tries to make a couple adjustments to address this error, but it’s possible that the level of new business creation has been so elevated recently that the BLS’ adjustments do not fully account for it.
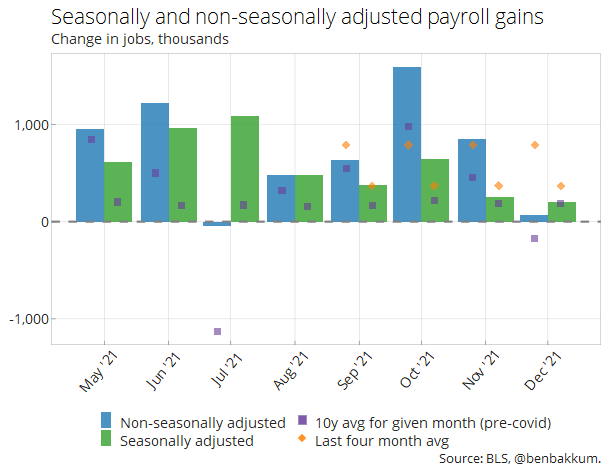
On a non-seasonally adjusted basis, the net number of payrolls added in December was higher than the average of all the Decembers of the 10 years preceding covid. On a seasonally adjusted basis, December job gains were average based on longer-term history, but appear soft in the context of gains earlier in 2021.
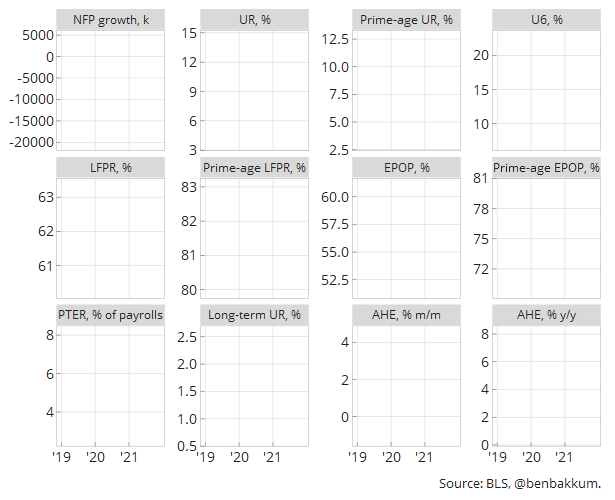
Despite the lower than expected net number of job gains, the unemployment rate and employment-to-population ratios improved in a way that made it look like a month of strong labor market conditions.
| Jun-21 | Jul-21 | Aug-21 | Sep-21 | Oct-21 | Nov-21 | Dec-21 | |
|---|---|---|---|---|---|---|---|
| NFP growth, k | 962 | 1,091 | 483 | 379 | 648 | 249 | 199 |
| UR, % | 5.9 | 5.4 | 5.2 | 4.7 | 4.6 | 4.2 | 3.9 |
| Prime-age UR, % | 5.5 | 4.9 | 4.7 | 4.4 | 4.1 | 3.7 | 3.5 |
| U6, % | 9.8 | 9.2 | 8.8 | 8.5 | 8.2 | 7.7 | 7.3 |
| LFPR, % | 61.6 | 61.7 | 61.7 | 61.7 | 61.7 | 61.9 | 61.9 |
| Prime-age LFPR, % | 81.7 | 81.9 | 81.8 | 81.6 | 81.7 | 81.9 | 81.9 |
| EPOP, % | 58 | 58.4 | 58.5 | 58.8 | 58.9 | 59.3 | 59.5 |
| Prime-age EPOP, % | 77.2 | 77.9 | 78 | 78.1 | 78.3 | 78.8 | 79 |
| PTER, % of payrolls | 3 | 2.9 | 2.9 | 2.9 | 2.9 | 2.7 | 2.5 |
| Long-term UR, % | 2.5 | 2.1 | 1.9 | 1.6 | 1.4 | 1.4 | 1.2 |
| AHE, % m/m | 0.4 | 0.4 | 0.4 | 0.6 | 0.6 | 0.4 | 0.6 |
| AHE, % y/y | 3.7 | 4 | 4.1 | 4.5 | 5 | 5.1 | 4.7 |
| Source: BLS, @benbakkum. |
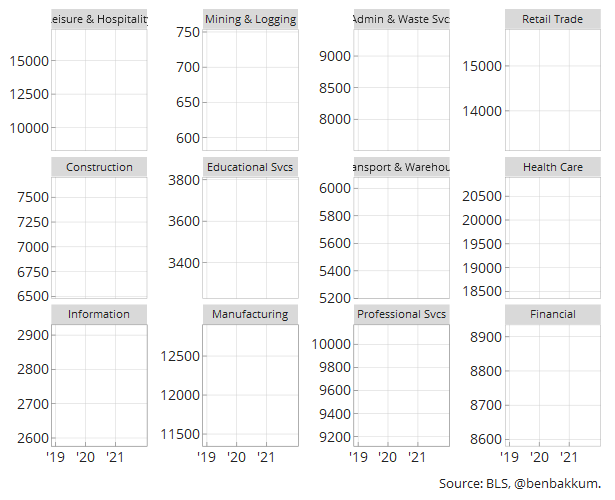
Transportation and warehousing as well as professional service jobs continue to stand out as industries where employment is growing at a strong pace, even though they’re already well above pre-pandemic levels of employment. Leisure and hospitality as well as health care job gains have slowed, likely reflecting the ongoing effects of the pandemic.
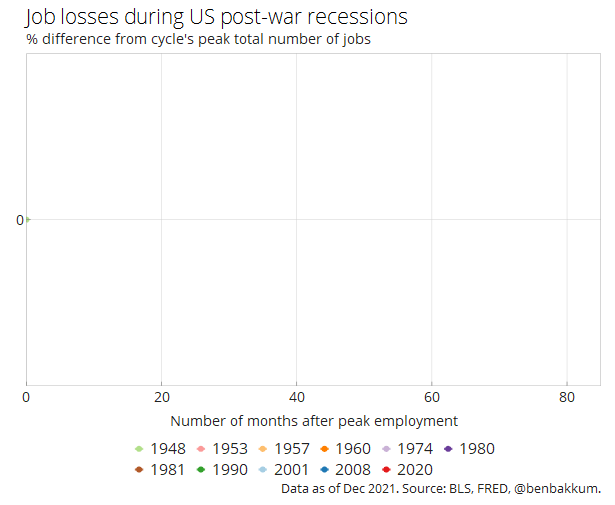
The chart below shows the strong pace of this recovery relative to other recessions.
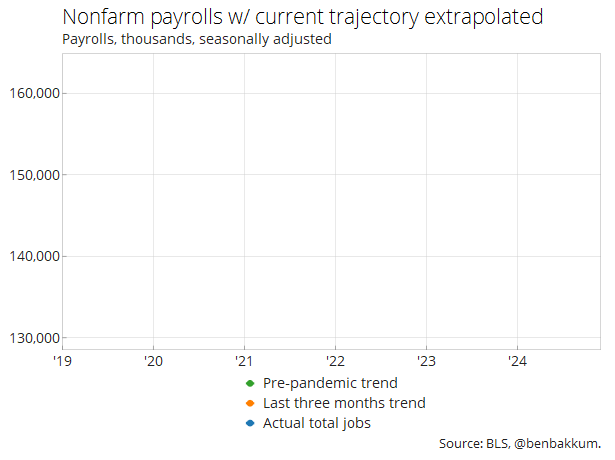
If the average job growth of the last three months continues at the same pace, the total number of jobs would fully recover to where it would have likely ended up had the pandemic not occurred around the end of 2024. In many ways that would be an even tighter labor market than before the pandemic as the population has aged and a large number of workers have retired in the intervening period.
An aggregate measure of labor market conditions, the Blanchflower-Levin employment gap, shows that slack continues to decline, with underemployment (a major source of slack during the last cycle) and unemployment slack having already disappeared according to this measure. My interest continues to be in how long the participation gap will linger during this cycle.
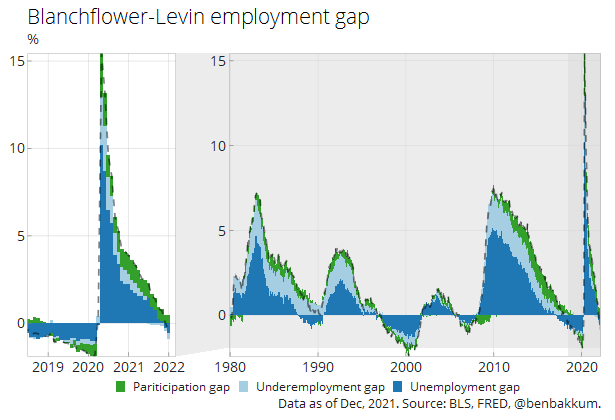
Note: the unemployment gap is the difference between the unemployment rate and the non-accelerating inflation rate of unemployment (NAIRU). The participation gap is the difference between the labor force participation rate (LFPR) and the CBO’s estimate of the potential LFPR. The underemployment gap is the difference between the number of employees working part-time for economic reasons as a percentage of the labor force, adjusted for the difference in the average number of hours worked by part-time and full-time employees, and the 1994-2007 average of this calculation.


